

By Dave Jesse, COO
I am excited to bring you my last of four posts breaking down the blueprint behind our Glass Warehouse Initiative. If you haven’t already read the background or my previous posts (click here), I would encourage you to start there to better understand what I am discussing. If you are skipping ahead, this initiative was developed to give our clients visibility into the logistics services we provide. We broke it down into three key areas of focus – systems, technology, and data. Each has played an integral part in creating transparency throughout our facilities, from receiving and shipping to managing inventory and data analytics.
 My focus for this last post will be how the Glass Warehouse Initiative is enabling our clients to have visibility into the data that flows throughout our warehouses. We’ve invested heavily in resources to be able to make this a reality, including advanced systems, connected technology, and innovative data analytics.
Our warehouse management system (WMS) Cadence, designed by Cadre Technologies, is a robust system that aggregates data from different sources such as ERP systems, warehouse technology, and shipping software. It captures all the detail transactions revolving around the inventory movement of our customers’ product. Every receipt that happens against a product, every shipment that happens against the product, where products get shipped to, where products got sent from, lot numbers, expiration dates, tracking and tracing information, all this detail is maintained at some point in our system. That means there is a wealth of data inside the WMS that we are able to provide and analyze for our customers.
In order for our clients to be able to see this data, we designed a secure, propriety customer web portal called BLI Web. This system makes this data available in real-time for our clients to view, with access 24/7 to see what’s going on inside our facilities. And to make sure this data is constantly available and protected, we house our core servers at a world class data center that allows us to enhance the scalability and security of our infrastructure.
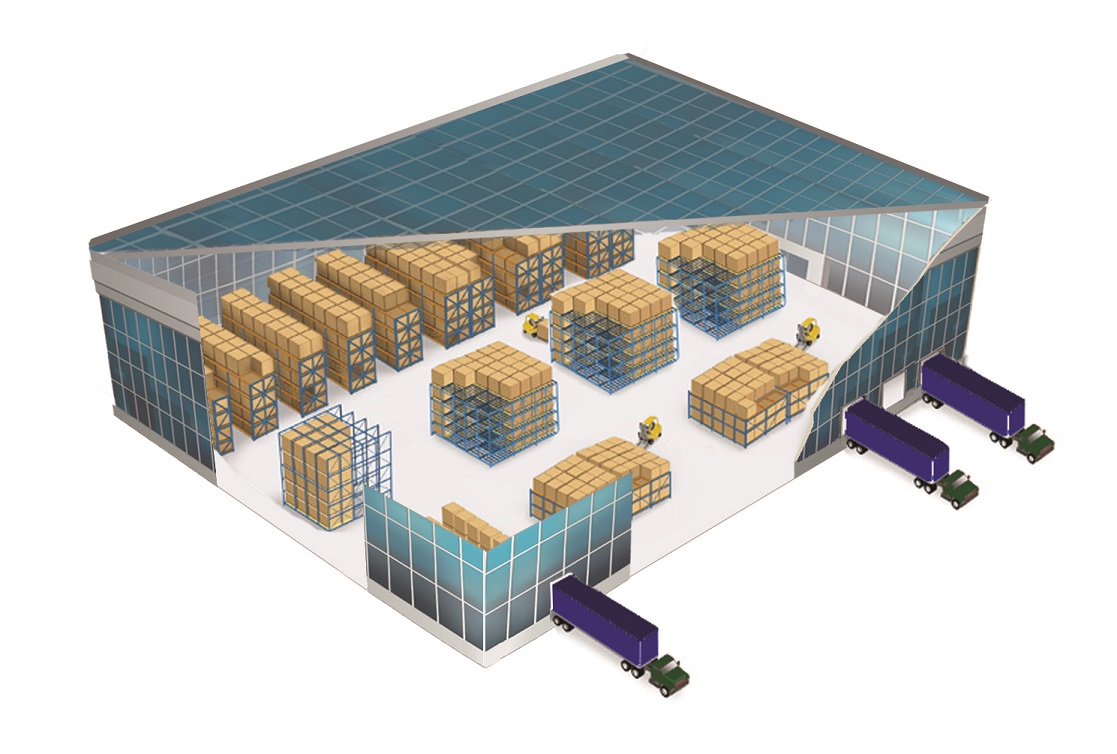
Technology in the 3PL world is nothing new, but connected technology has enabled us to gain a tremendous advantage in visibility on the warehouse floor. This technology takes on many forms, such as RF guns for scanning inventory in and out, unique barcode printers for specific labeling, tablets for conducting physical inventories, and wireless warehouses to make sure information is flowing in real time. Connected technology allows for data transactions to be captured by Cadence and immediately be visible in BLI Web, allowing customers access to what’s going on with their inventory and orders.
Both systems and technology enable the visibility to the data, but what we are finding most important is our client’s ability to analyze this data. This starts with utilizing our web portal to generate reports that detail receipts, shipments, and inventory. A historical data perspective is important to see what we shipped last week, last month, last year, but the challenge now is that things are happening so fast that we have to provide that same analytical work for today’s activities. For instance, we have 500 orders going to the West Coast, we can figure out what’s the optimal way to load those trucks, and to do that in the speed of today’s business.
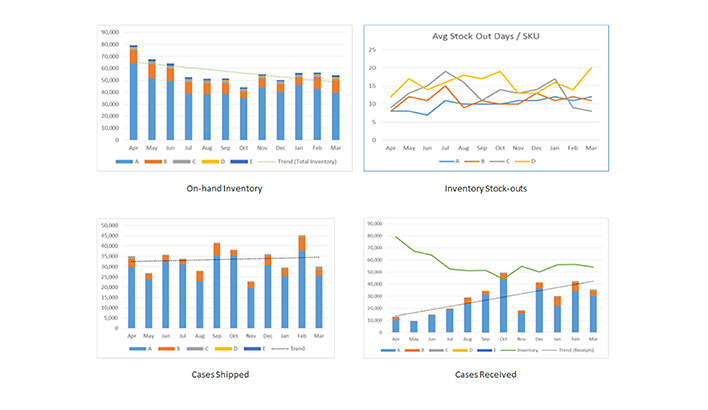 Data analytics gets interesting when talking to customers with helping them understand the movement and velocity of product, while also helping us to slot product in the warehouse. Customers can look at it from an inventory replenishment standpoint, understanding how often they need to replace product. And this takes us into the next phase of this, which is to be able to not only show the fast-moving items, but also show if there was an out-of-stock item. This has been eye-opening to some customers that they were actually out-of-stock of fast-moving items for multiple days during a month. This decreases their sales and increases their backorders with their customers, and their customer service levels go down.
Something I am really looking forward to is working with new business intelligence tools that allow us to bring data together from our WMS as well as labor management, payroll and financial systems. We will be able to analyze this aggregated data, looking at it from different standpoints like transportation, inventory, worker productivity, and warehouse slotting. Pulling data from multiple areas like this will help us make better decisions about making improvements to our customers’ supply chain. And that’s really what we’re all about.
Does your logistics’ partner offer up this kind of visibility with your data? If not, reach out to us so we can start a conversation about how we can help.